


Traders often use price bars to forecast how the underlying asset price will do (go up or down). It helps them open trades on time and earn extra income. Let’s look at a pattern consisting of just one candlestick, a Belt Hold.
The Belt Hold candlestick pattern

A candlestick pattern that is formed by a single Japanese candle during an uptrend or downtrend is called the Belt Hold. It indicates a possible reversal of the current trend. The pattern closes inside the body of the previous candle as if keeping the price from moving in the same direction.
The Belt Hold pattern can be recognized when a candle of a different color appears on the chart: green for a downtrend, red for an uptrend. It often appears on the chart and is therefore not considered reliable. The Belt Hold candlestick pattern is important to understand how it works and apply the trading strategy correctly to forecast trends.
Binomo traders often use candlestick charts for analysis and trading. Let’s look at how Bearish and Bullish Belt Holds work on the Binomo candlestick chart.
The Bearish Belt Hold
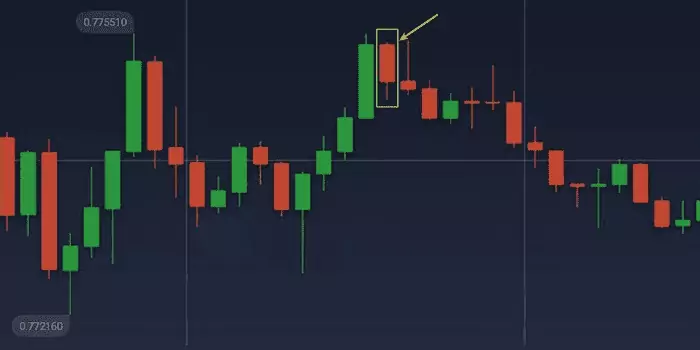
The Bearish Belt Hold pattern can be found on the candlestick chart in an uptrend. It indicates a possible trend reversal.
These three signals will help identify the Bearish Belt Hold pattern:
- A red (bearish) candle appears after several bullish bars.
- The opening of a bearish candlestick is higher than the close of the previous bar. On an intraday chart, the opening and previous closing prices may be the same.
- The red candle is long with a short lower wick. The upper wick of the candle is missing or undersized.
The pattern is easy to spot on the Binomo candlestick chart, but you should not open a trade without confirmation. Three candles will help confirm the signal:
- First comes a green candle, a long bullish trend.
- This is followed by a bearish bar with a long lower shadow and a short or no upper shadow.
- And again, a red candle.
So, the addition of another red candle indicates a possible development of a downtrend.
The Bullish Belt Hold

The pattern of the single-day Japanese candlestick, which suggests a reversal of a prevailing downtrend, is called the Bullish Belt Hold. It is also known as yorikiri in Japanese. The pattern is noticeable across any timeframe, but it is useful in daily and weekly charts.
Let’s look at three steps to spot the Bullish Belt Hold pattern:
- А green (bullish) candle occurs after several bearish bars.
- The opening of a bullish candlestick is lower than the close of the previous one if you look at the Binomo chart.
- The green candle is long with a short upper wick and no lower wick.
When the Bullish Belt Hold pattern appears at a support level, its strength increases. So, watch the Binomo candlestick chart for a Bullish Belt Hold pattern to appear at the support level.
Note! The Bullish Belt Hold is easy to spot, but you must confirm the signals. Its reliability is improved if it forms about a support level.
Conclusion
The Belt Hold pattern is formed by a single Japanese candlestick and can be bearish or bullish. When it forms during an uptrend, it is called a Bearish Belt Hold pattern; during a downtrend, it is called a Bullish Belt Hold pattern. Both cases indicate a possible trend reversal; that is, the price may change direction after it appears.
The Belt Hold pattern is often formed on the chart, so it is important to be able to confirm the received signal. Otherwise, you may lose your investment. Also, the correct trading strategies and practice on the Binomo demo account, where you can study this candlestick pattern on real charts, will help reduce the risk of losing funds.


